Abstract
Tissue Doppler Imaging (TDI) is an essential echocardiographic technique for non-invasive assessment of myocardial velocity.
Manual interpretation by experts is time-consuming and prone to subjectivity.
This study presents an automated deep learning system trained and tested on Doppler strips of arbitrary length, capable of rapid beat detection and Cartesian coordinate localisation of peak velocities.
The model achieves expert-level accuracy while operating significantly faster, offering a scalable solution for improving clinical workflow.
Introduction
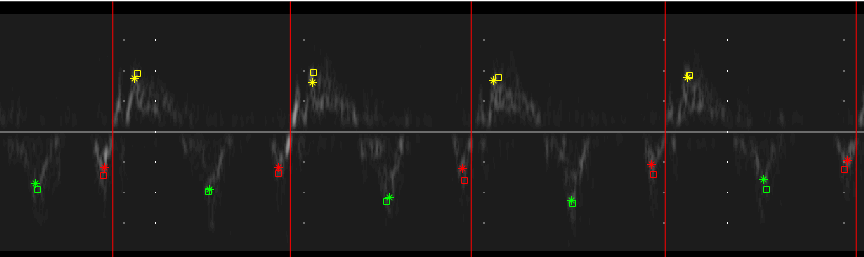
Example Doppler strip with expert annotations (crosses and squares) for each cardiac cycle.
Tissue Doppler imaging (TDI) applies Doppler principles to measure the velocity of myocardial motion.
While clinical guidelines recommend averaging peak velocity measurements over at least three consecutive beats, echocardiographers often select representative samples manually — introducing variability and potential diagnostic errors.
An automated, objective system could:
- Improve reproducibility and efficiency
- Allow averaging over many beats
- Reduce subjectivity and clinical cost
Each cardiac cycle is marked by a red vertical line, with annotations from two trained experts for comparison.
Method
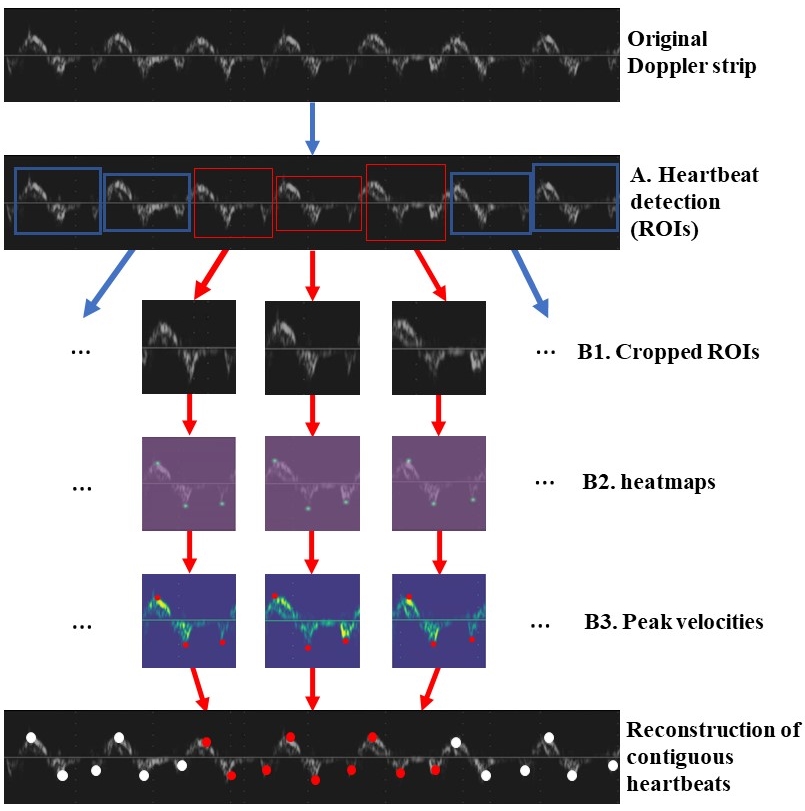
Fig. 1. Overview of the automated multi-beat TDI analysis pipeline.
TDI traces were acquired from 48 patients (mean age 64 ± 11 years), covering both septal and lateral annuli.
Six recordings were taken per patient and reconstructed into continuous Doppler strips (900×1300 px).
Dataset Summary:
- 280 Doppler strips
- 5,327 annotated beats
- Annotations from 3 expert clinicians
- Consensus labels used as ground truth
Additionally, three auxiliary models (Model-1, Model-2, Model-3) were trained on individual expert labels to assess inter-observer variability.
Architecture
The system comprises two major components:
A. Beat Detection:
- Beats detected via Mask R-CNN with a ResNet101 backbone
- Input resized and zero-padded to 1024×1024 px
B. Keypoint Regression (B1–B3):
- Cropped ROIs resized to 192×192 px
- Input to a convolutional heatmap regression network
- Predicts Cartesian coordinates for S’, E’, and A’ (systolic and diastolic peaks)
Results and Discussion
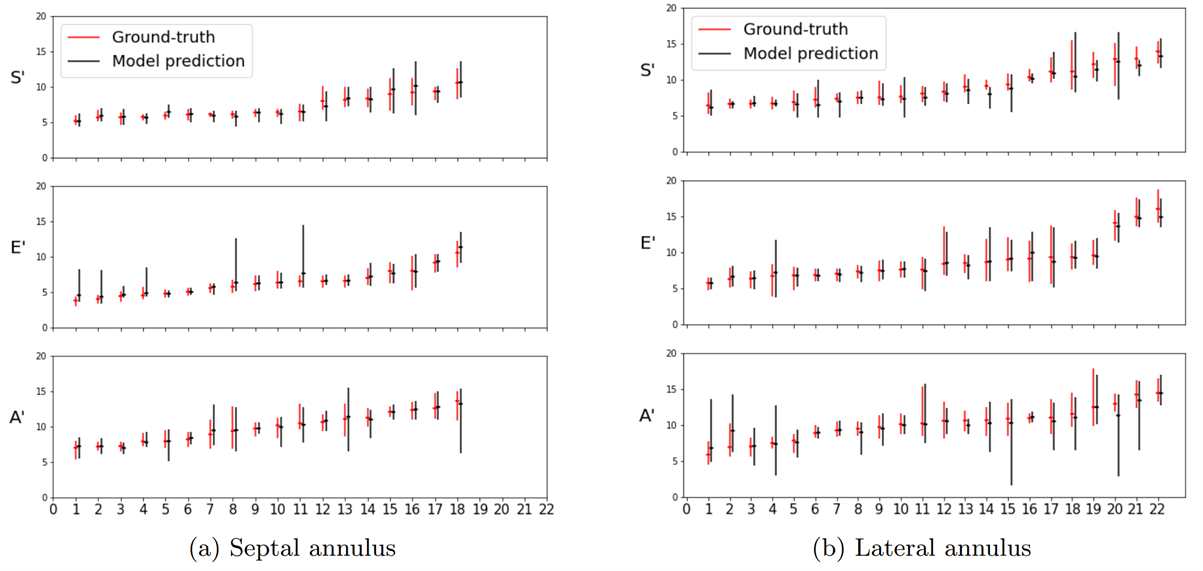
Mean septal S’, E’, and A’ velocity estimates and standard deviations for experts (red) and model (black).
Manual expert annotations vs. automated model computation times:
- Human: 4.76 seconds per 25 beats
- Model: 0.18 milliseconds
Velocity estimates were derived from Cartesian pixel coordinates (converted to cm/s).
Observations
- Model accuracy is comparable to human experts
- Errors fall within inter-observer variability
- Processing speed vastly exceeds human annotation
Bland–Altman Comparison of Human vs. Model Performance
| Model/Expert | S’ (Septal) | E’ (Septal) | A’ (Septal) | S’ (Lateral) | E’ (Lateral) | A’ (Lateral) |
|---|---|---|---|---|---|---|
| Human Performance | ||||||
| Exp 1,2 vs. Expert-3 | 0.13±0.59 | -0.18±0.59 | -0.06±0.84 | 0.33±0.91 | 0.15±0.92 | 0.11±0.84 |
| Exp 1,3 vs. Expert-2 | 0.06±0.50 | -0.22±0.60 | 0.29±0.70 | 0.33±0.87 | 0.12±0.80 | 0.17±0.75 |
| Exp 2,3 vs. Expert-1 | -0.19±0.63 | -0.04±0.56 | -0.24±0.69 | -0.66±0.94 | -0.27±0.77 | -0.27±0.78 |
| Expert Consensus | -0.14±0.67 | 0.06±0.70 | -0.08±0.90 | -0.44±1.10 | -0.19±0.97 | -0.17±0.92 |
| Machine Performance | ||||||
| Exp 1,2 vs. Model-3 | -0.01±0.82 | -0.42±1.00 | -0.11±0.85 | 0.59±0.93 | 0.08±1.32 | 0.38±1.87 |
| Exp 1,3 vs. Model-2 | 0.04±0.93 | 0.15±0.94 | 0.44±0.98 | 0.50±0.93 | 0.19±1.10 | 0.21±1.66 |
| Exp 2,3 vs. Model-1 | -0.12±0.97 | -0.17±0.94 | -0.15±0.99 | -0.11±1.02 | -0.04±0.93 | -0.04±1.35 |
| Expert Consensus vs. Model | -0.07±0.78 | -0.22±0.92 | -0.02±0.88 | -0.38±0.81 | -0.06±0.84 | 0.19±1.38 |
Access the Dataset
We aim to make the TDI dataset available for research use soon.
If you wish to request access, please visit:
Request Dataset Access →
Project Team
References
- TDI Beat and Keypoint Detection
- Automated Multi-beat Tissue Doppler Echocardiography Analysis Using Deep Neural Networks