Project Introduction
The segmentation of Left Ventricle (LV) is currently carried out manually by the experts, and the automation of this process has proved challenging due to the presence of speckle noise and the inherently poor quality of the ultrasound images.
This study aims to evaluate the performance of different state-of-the-art Convolutional Neural Network (CNN) segmentation models to segment the LV endocardium in echocardiography images automatically.
Those adopted methods include U-Net, SegNet, and fully convolutional DenseNets (FC-DenseNet).
The prediction outputs of the models are used to assess the performance of the CNN models by comparing the automated results against the expert annotations (as the gold standard).
Results reveal that the U-Net model outperforms other models by achieving an average Dice coefficient of 0.93 ± 0.04, and Hausdorff distance of 4.52 ± 0.90.
Dataset
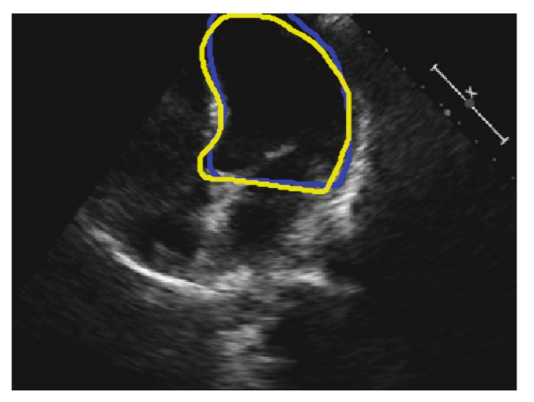
Fig. 1. An example 2D 4-chamber view. The blue and yellow curves represent the annotations by Operator-A and Operator-B, respectively.
The study population consisted of 61 patients (30 males), with a mean age of 64 ± 11, who were recruited from patients who had undergone echocardiography with Imperial College Healthcare NHS Trust.
Only patients in sinus rhythm were included. No other exclusion criteria were applied. The study was approved by the local ethics committee, and written informed consent was obtained.
Each patient underwent standard Transthoracic echocardiography using a Philips iE33 system by experienced echocardiographers. Apical 4-chamber views were obtained following standard clinical guidelines.
Each recording was 10 seconds long, ensuring at least three cardiac cycles per cine loop.
To account for probe placement effects, the process was repeated three times per patient, yielding three 10-second cine loops.
A total of 992 frames were manually annotated by two operators, with annotations used as the ground truth for model training and comparison.
Network Architecture
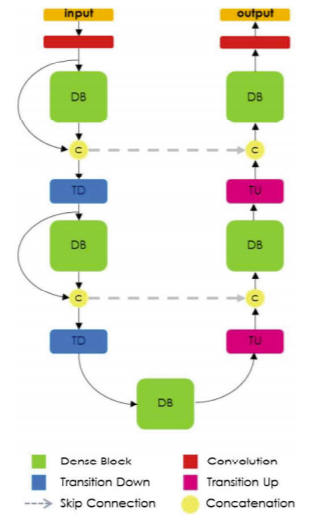 Fig. 2. Diagram of FC-DenseNet architecture for semantic segmentation.
The U-Net architecture was first used since it is applicable to multiple medical image segmentation problems.
It consists of three main steps: down-sampling, up-sampling, and cross-over connections.
Each down-sampling and up-sampling block contains five levels, each with two convolutional layers (kernel size 3×3).
Max pooling (2×2) is used for down-sampling.
In addition to U-Net, SegNet and FC-DenseNet models were also investigated.
SegNet includes encoder-decoder layers using pooling indices for non-linear upsampling.
FC-DenseNet consists of down-sampling and up-sampling paths made of dense blocks with transitions up (TU) and transitions down (TD).
Skip connections are included before and after dense blocks.
All models produce outputs with the same spatial size (320×240).
Implementation
All models were implemented in PyTorch using the Adam optimiser with 250 epochs and a learning rate of 0.00001.
Network weights were randomly initialized, and Negative log-likelihood loss was used as the objective function.
Training was performed on an NVIDIA GeForce GTX 1080 Ti GPU.
Each model was trained separately using annotations from either Operator-A or Operator-B, referred to as:
- GTOA / TOB: Ground truth annotations by Operator-A / Operator-B
- POA / POB: Predictions from models trained on GTOA / TOB
Evaluation Measures
The following metrics were used to evaluate model performance:
- Dice Coefficient (DC): Measures overlap between predicted and ground-truth regions (0 = none, 1 = perfect overlap)
- Hausdorff Distance (HD): Measures the maximum distance between contour points of prediction and ground truth
- Intersection-over-Union (IoU): Also known as the Jaccard index, measures overlap relative to union of regions
Experiment Results and Discussion
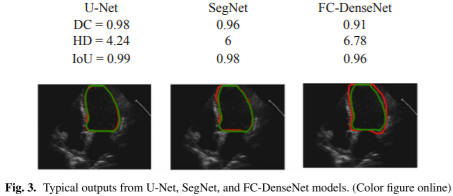
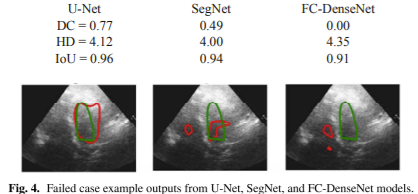
Figure 3 shows example outputs from the three models trained using annotation provided by Operator-A.
The red solid line represents automated results, while the green line represents manual annotation.
The U-Net model achieved higher DC (0.98), higher IoU (0.99), and lower HD (4.24) compared to others.
Visual inspection confirms smoother LV border prediction with U-Net.
Figure 4 illustrates a failed case for which all models struggled due to poor image quality, noise, or low contrast.
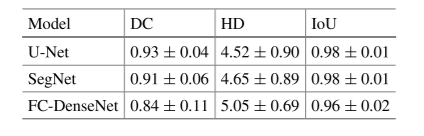
Table 1. Comparison of evaluation measures of (DC), (HD), and (IoU) between the three models.
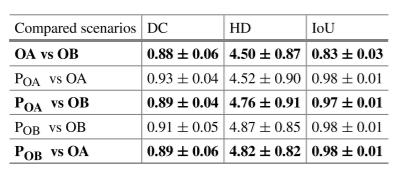
Table 2. Comparison of evaluation measures (DC), (HD), and (IoU) for the U-Net model between five possible scenarios.
Table 1 shows that U-Net achieved the best overall performance, with the highest DC and lowest HD.
Table 2 compares inter-operator and automated differences — automated models performed comparably to human experts.
Conclusion and Future Work
Manual annotation of left ventricle borders in echocardiography is time-consuming and operator-dependent.
Automated CNN-based models can assist clinicians by providing consistent and accurate results without human intervention.
Performance decreases when image quality is poor, suggesting a bias due to an unbalanced dataset.
Future work will include using more diverse datasets, exploring different cardiac views, and evaluating models across various ultrasound vendors.
Project Team
References
Segmentation of Left Ventricle in 2D Echocardiography Using Deep Learning