Project Introduction
Although literature supports the notion that seizure detection algorithms require the ability to differentiate convulsive movements from common everyday activities, little has been done to achieve this.
Seizure detection algorithms are commonly trained using sequential event prediction, where the measurements from past seizures are used to predict future occurrences. This approach has maintained a high false positive rate, as the detection process fails to account for movements that share the same spatial coordinates, often incorrectly classifying unrelated movements as a positive event.
This project addresses the problem at an algorithmic level, developing a deep learning model for accelerometer-based detection that combines activity recognition with traditional seizure detection techniques.
Dataset
- Data collected from 10 participants (8 healthy, 2 with juvenile myoclonic epilepsy)
- Wrist-worn tri-axial accelerometer and gyroscope, 25Hz, 48-hour recording
- Movements included: brush teeth, jogging, walking, lie-down, sitting, upstairs, downstairs, make sandwich, sleeping, standing, watching TV, and seizure
- 12 genuine seizures recorded, 34 simulated seizures guided by video recordings
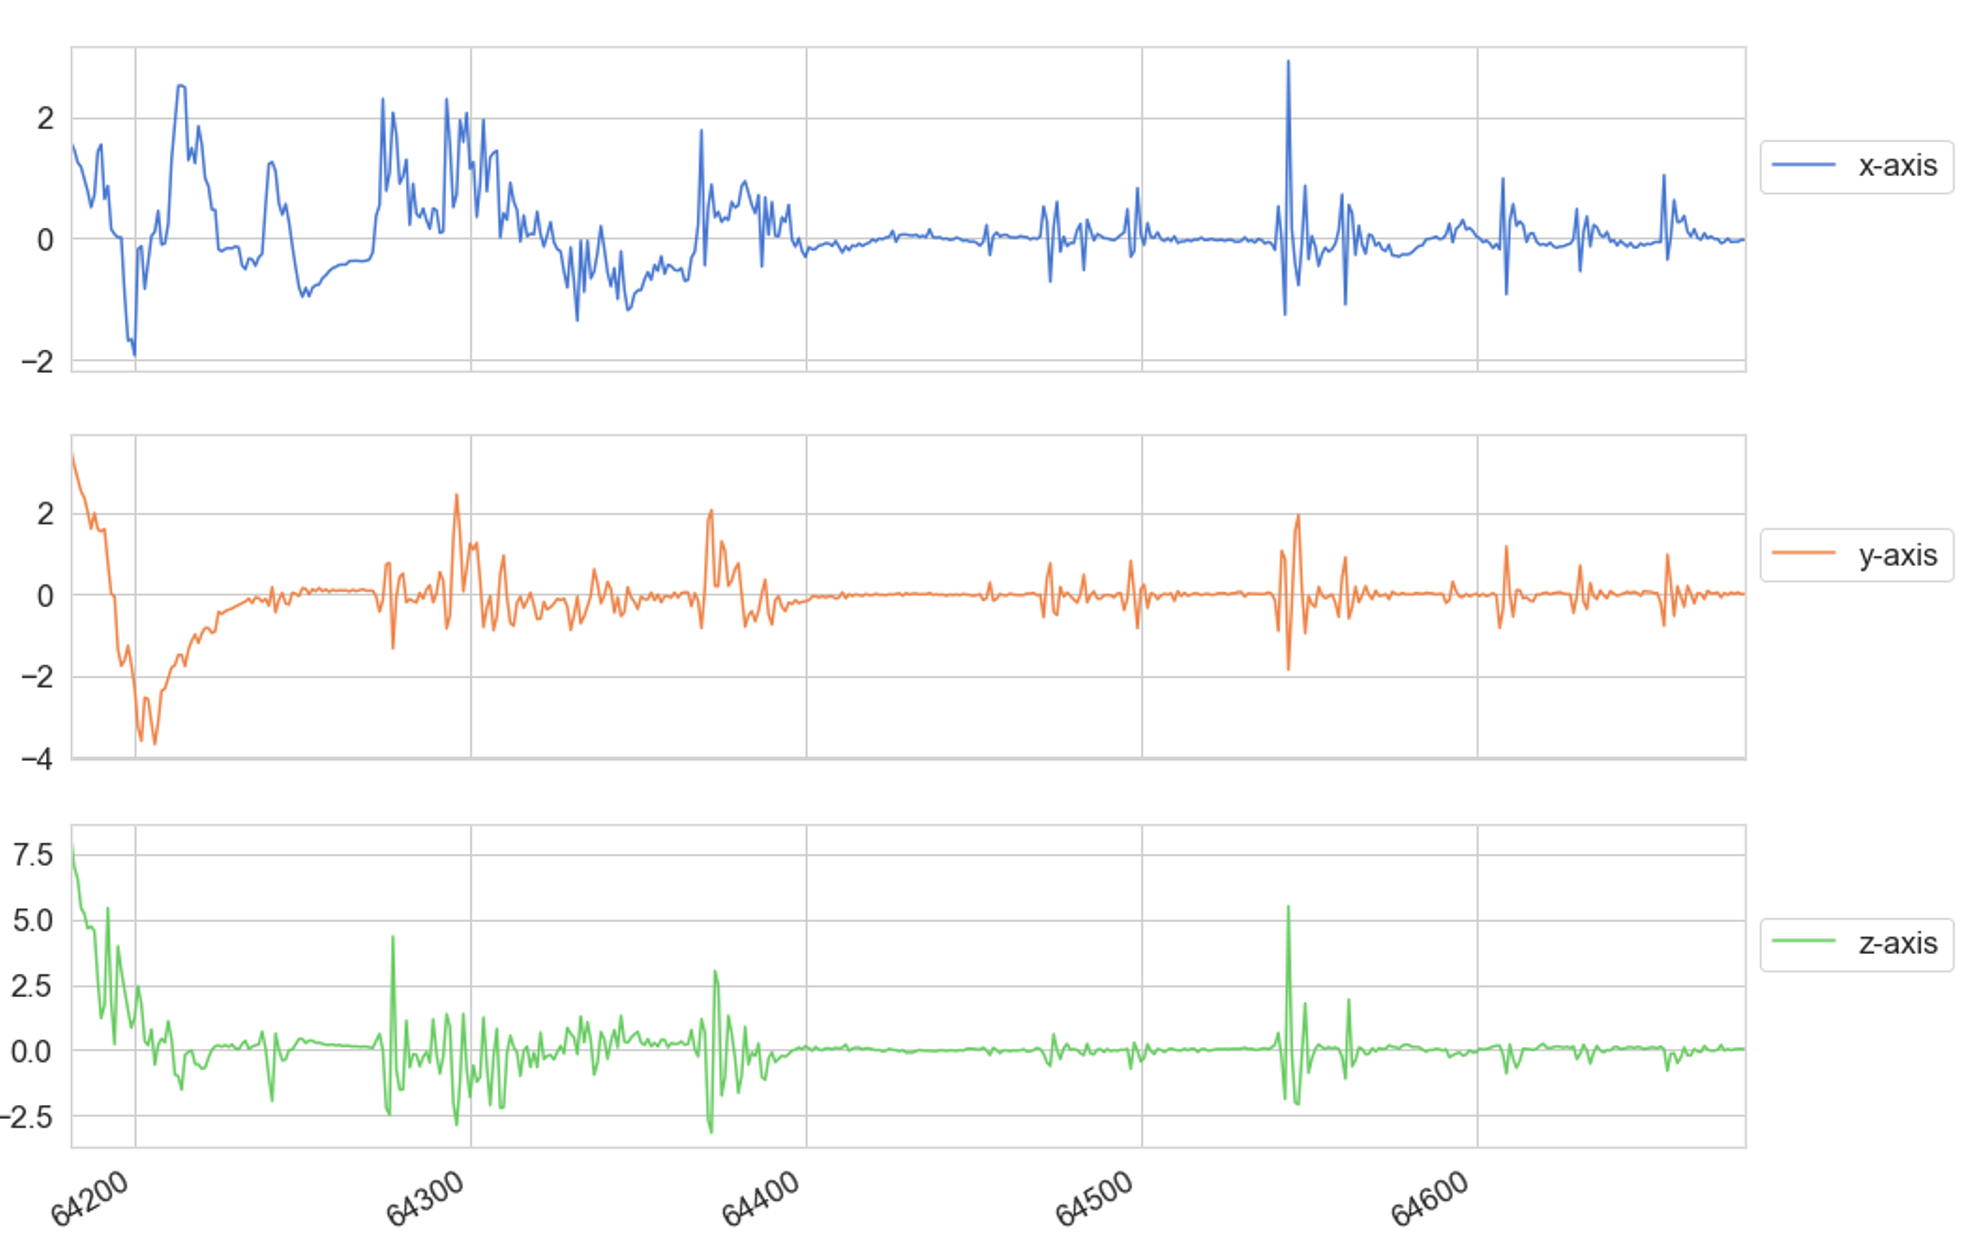
A timesequence of x,y,z accelerometer data

Participant mimicking a generalised tonic-clonic seizure
Feature Engineering and Pre-processing
- Each movement performed 5 times (≤30s duration)
- Data segmented into 10s fixed sequences (200 samples each)
- Segmented data used to train and test the model
Network Architecture
This project used a stacked LSTM neural network for multi-class classification of fixed length time sequences.
- 2 fully connected layers
- 2 stacked LSTM layers (64 units each)
- ReLU activation in hidden layers
- Softmax output for multi-class classification
.png)
Stacked LSTM network architecture
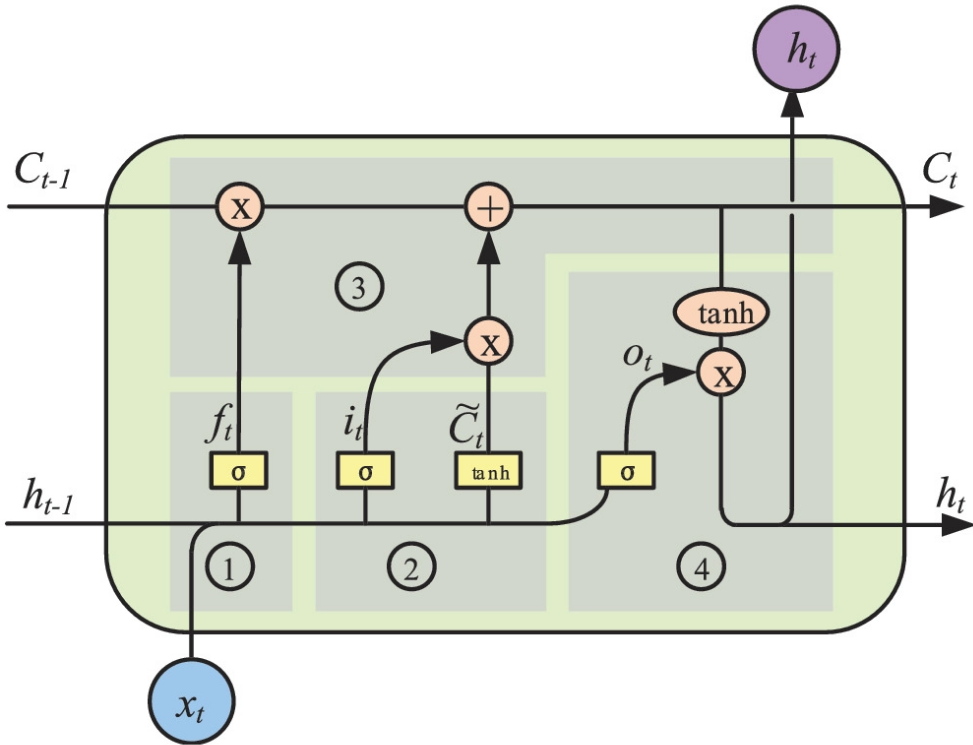
Structure of a single LSTM unit
Components
- L2 Regularisation: to prevent overfitting
- Loss Function: cross-entropy with L2 regulariser
- Softmax Function: probability distribution for classification
- Optimizer: Adam, combining AdaGrad + RMSProp advantages
Implementation
- Developed in Python with TensorFlow 2.0 and Keras
- Training conducted on Google Colab
- Train/Test Split: 75% / 25%
- Learning Rate: 0.0025
- L2 Loss: 0.0015
- Epochs: 50

Training accuracy and loss for the stacked LSTM
Evaluation
Evaluation based on confusion matrix values: TP, FP, TN, FN.
Metrics calculated: accuracy, precision, recall, F-measure.
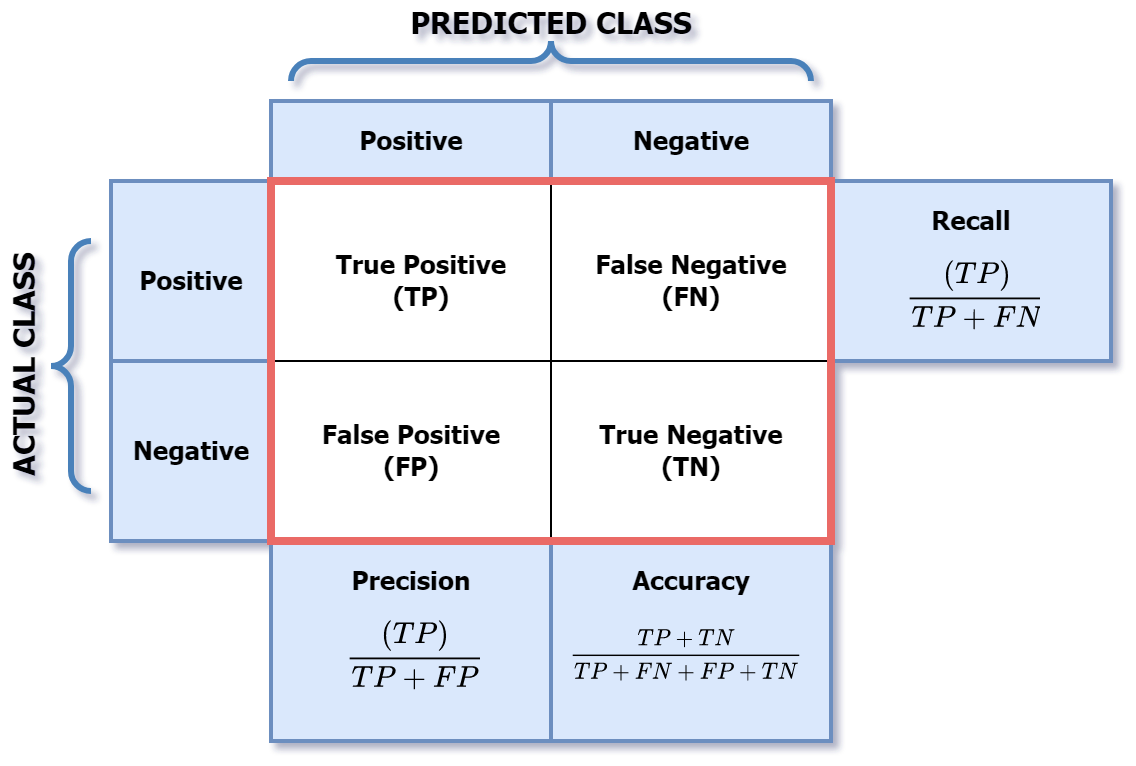
Classification performance measures
Results
- Precision: 92% (seizures correctly distinguished 92% of the time)
- Recall: 87% (positive values correctly identified)
- F-measure: 89% (harmonic mean)
- Overall Accuracy: 94.74%
- Loss: 0.334
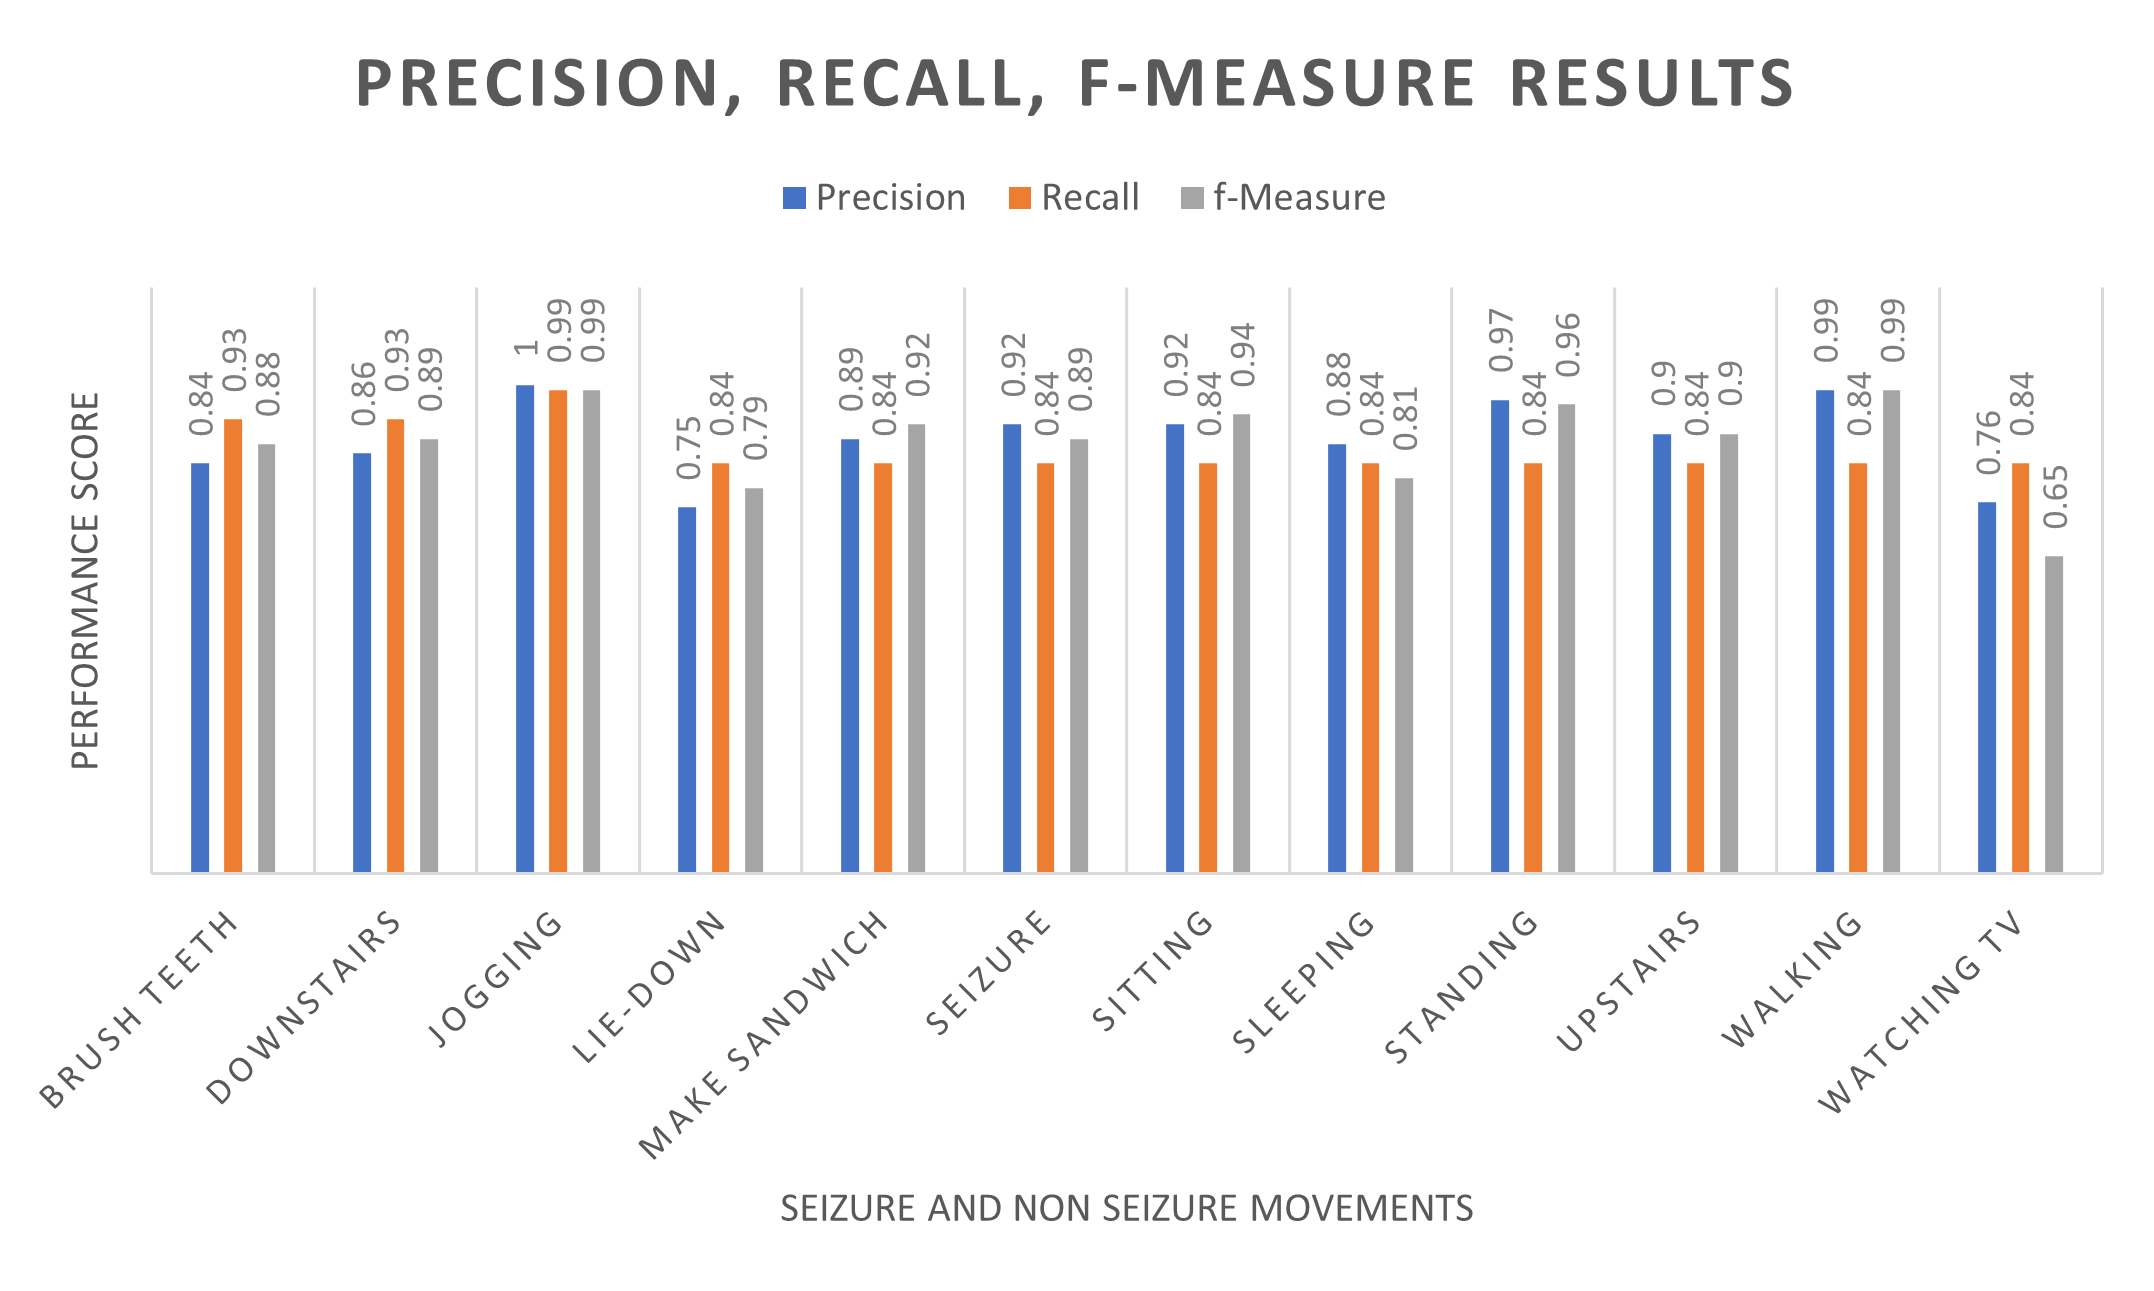
Precision, Recall and F-measure Results
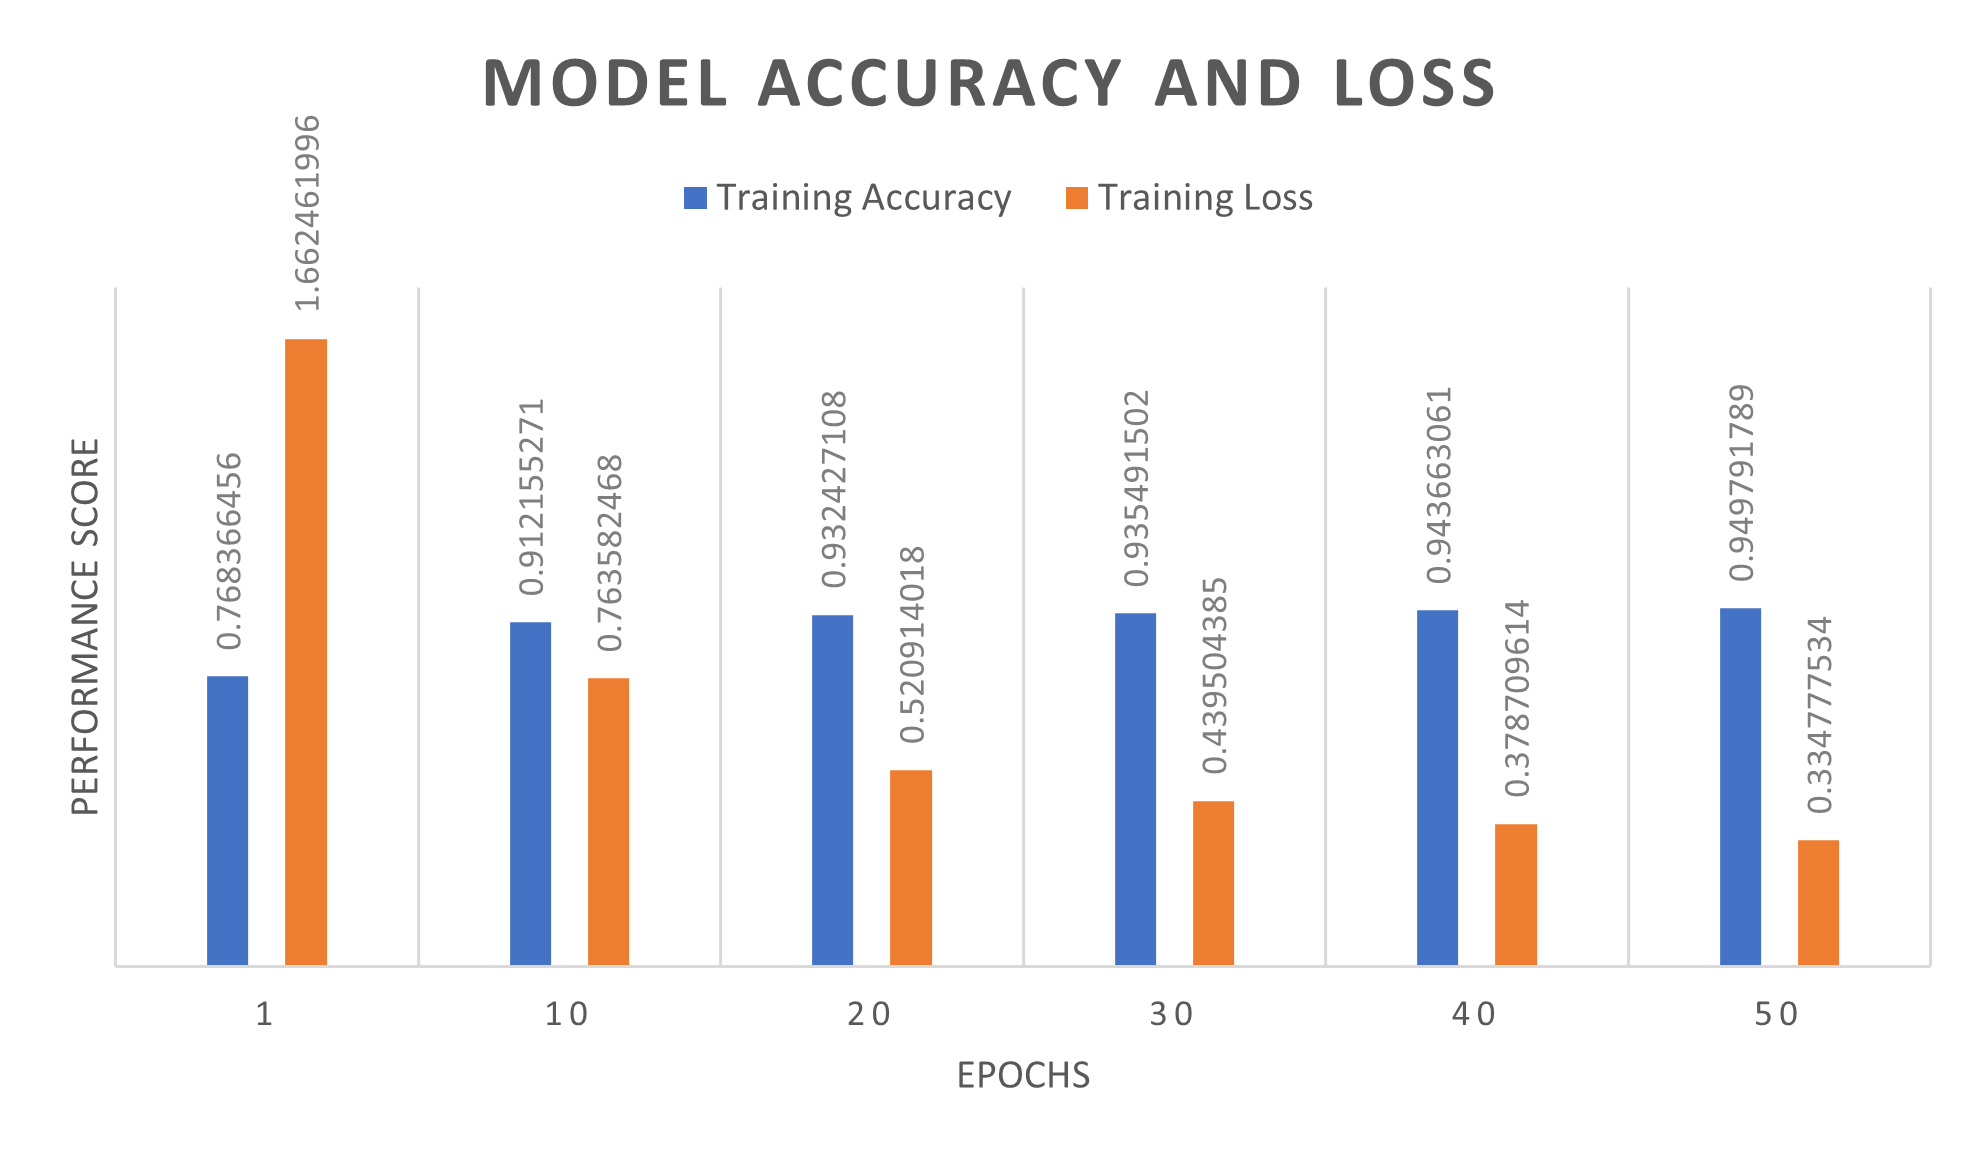
Accuracy and Loss Results